With the news that Leichhardt Council is planning to put speed bumps in on Lilyfield Road – in part to slow ‘speeding cyclists’ – I thought it might be an idea to focus on this much maligned and much ridden section of Sydney road and see if we can come up with some numbers on just how fast riders are going, and see whether Leichhardt Council is right in their decision.
Beware. Nerdery follows below the fold.
Here’s the segment in question. 400m of tarmac at an average downhill grade of 5%. The start is at the light-controlled junction with Mary Street and James Street, at the Bicycle Garage. The end is at the foot of Lilyfield road, where the road curves left into the Canal Road dead-end, and the Bay Run crosses Hawthorne Canal by bridge straight ahead. There are five emerging streets on the left-hand side.
There have been several incidents over the last year or so involving bicycles descending the road and cars emerging from the side streets. This is the largest objective danger on the segment. There is right of way for vehicles on Lilyfield Road, but lines of sight aren’t ideal with cars parked between junctions. Drivers pull out into the path of descending riders on a fairly regular basis, though usually without major incident.
It should be pretty clear that the lines of sight for emerging drivers are the problem, but muddying the water is a perception that cyclists increase the danger by exceeding the posted speed limit of 50km/h. Let’s lay aside for the moment the fact that there’s no statutory offence of speeding on a bicycle in NSW, our first question: is this assertion true? Do riders exceed 50km/h? Do they do it by a significant margin, breaking, say, 60?
Let’s examine these two thresholds.
According to the Strava leaderboards for Slide, 67 riders have posted a segment speed of over 60km/h. The KOM is currently displayed as 72.7km/h, two seconds faster than the following nine riders, at 66.4km/h or 23 seconds. 617 riders out of 2527 have posted a time over 50km/h.
I ride down this road most days, and have 196 recorded times. I’ve posted a time of 24 seconds – 63.6km/h average – once, and have posted 25 seconds – 61.1km/h – on seven further occasions.
Yes, I’ve ‘broken the limit’ down this road. I’ll take this opportunity to remind readers that there’s no statutory offence of speeding on a bicycle in NSW.
According to my own measurements, using a Garmin Edge 500 with Duotrap wheel sensor on board, I’ve peaked at over 70km/h on more than one occasion. So we can say with a 100% certainty that some riders exceed the posted speed limit.
How many?
Well, the top 67 riders on the Strava leaderboard show a speed of over 60km/h. Some quick mathematics – 67 riders out of 2527 riders who have posted a time is… 2.65%.
Hmmm.
OK, for argument’s sake, how many riders go over 50km/h?
Well, 617 riders show an average speed of over 50km/h. That’s 24.41%. So, logically speaking, 75% of personal best times on Strava don’t even get over 50.
This is all very well, but adding complications to this calculation are a number of factors.
Complication number one: For reasons discussed here, Strava can magnify top speeds. Based on this, I believe the KOM time is inaccurate. GPS waypoints have an inbuilt margin of error, and short segments magnify these errors still further. Having exceeded 70km/h myself – measured by wheel sensor, not GPS – my gut feel is that averaging over 70 for the whole segment is very difficult and in fact a little implausible. One would need to be sprinting hard into the entry and exceeding a peak speed of 75km/h. To exceed 70km/h, I’m spinning out my 50×11 top gear. A standard 53×11 and a strong rider would be capable of faster, for sure, but the nature of the segment – flat entry, short descent – goes against it. The two second gap to the next riders also inspires a little skepticism.
So we should discount that outlier speed. The following riders at 66.4km/h? Definitely plausible, but may also be subject to error, for the very same reasons.
This brings us to Complication number two: are these riders doing this regularly?
Well, obviously not. These are the fastest speeds posted by these riders. Personal Records. In all, Strava shows it’s been ridden 33790 times by the 2527 riders. It’s absurd to think that each of these riders goes at their maximum speed every time. My own results, for example, show me exceeding a 60km/h average only eight times out of my 196 passes. That’s 4%. However, I’ve exceeded 50km/h on exactly 100 of my 196 passes. A slim majority, but considering I use this journey as interval training, alternating sprints with rests, not too surprising.
Now, to set a fast speed – 60-plus – on this segment, you have to have a confluence of factors coming together. You need good weather conditions for a fast time, naturally. You need a rolling start through the lights. You need a clear road and a good line of sight. You need to be riding well. You can’t merely roll down this hill and hit 60 on gravity alone. You have to put power down. You might hit 50 on mostly gravity, on a good day. If you’re lucky. With a tailwind.
All of this suggests to me that significantly exceeding the speed limit on Lilyfield Road is actually not all that easy and it just doesn’t happen on a regular basis. In fact, if my 4% is at all representative, we’re looking at 2% of riders exceeding 60km/h on 4% of their journeys, that would be 0.08% of all passes through this segment going over 60km/h. Applying the same logic to the lower threshold, roughly half of my rides were over 50, and roughly 25% of riders posted times over 50. Does this mean 12% of rides go over 50km/h? I’m not at all sure the logic holds. But maybe.
Now, complication number three, and it’s a biggie. We’re talking about average speed for the whole segment. Logic dictates that no-one is holding a constant speed all the way down. Peak speed is going to be higher. Based on an informal trawl through my own Strava traces, a fast time has a peak speed maybe 5km/h faster than the average for the entire 400m, and usually peaks out just before the road flattens. This may vary significanty – some riders may start out slower and achieve a higher top speed for a given average. So chances are some of the fastest riders in the 50-60km/h group may have had top speeds over 60, and some sub-50 riders may actually peak over 50. How many? Impossible to say without access to their data.
Complication number four: Strava does weird, inconsistent things to data. Here’s a screenshot of my 63.6km/h run on the segment last March
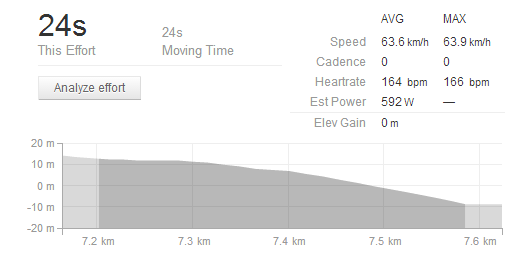
But when I click through to Strava’s “Analyze Effort” UI, I get completely different numbers, and a cited average of 56.7km/h
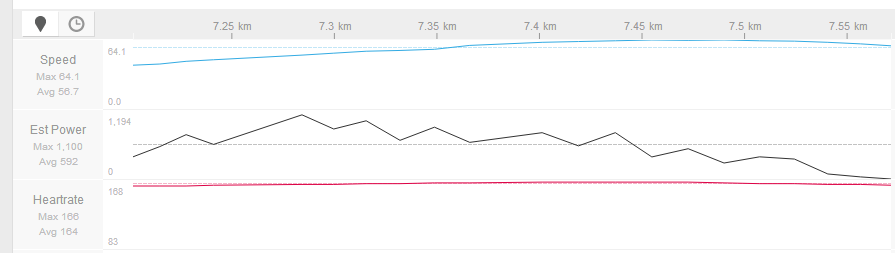
Did I even average over 60km/h? What did I really do? Who’s to say?
Complication number five: Is Strava representative of the riding community as a whole?
This is an important one. Strava’s populace is skewed towards enthusiasts, racers and speed freaks. Not everyone has a Strava account, but riders that do are more likely to come from the faster end of the scale. This would suggest that looking at Strava results will again bias our analysis towards the faster end of the spectrum. Which would mean that most riders aren’t getting anywhere near these speeds.
So, the first conclusion we have to draw from all of this is that excessive speed down Lilyfield Road, defined as ‘cyclists exceeding 60km/h’ is just not a significant problem. A minority of cyclists certainly exceed 50km/h – and I’ll just remind everyone that there’s no statutory offence of speeding on a bicycle in NSW – but by varying margins and not, by any means, on a consistent basis. It’s very hard to put an accurate figure on it, but I’d guess at maybe 10-15% of riders breaking 50. Hardly an epidemic. In my experience, bikes generally hold parity with vehicle traffic on this stretch, which is not by any means a bad thing.
So, this in mind, is it a good idea to put speed cushions in?
You know, the thing we were talking about before I went all data-centric? Oh yeah. Speed cushions.
I don’t think so, and here we go out of the realms of data and have to speculate a bit, based on experience and intuition.
Here’s one possible reason. My fastest Strava time, the one that shows 63.6km/h was posted on a full suspension mountain bike.
So what? Well, one thing that doesn’t much bother a full suspension mountain bike, somewhat by definition, is bumps. Some of my other quick times were posted on my Trek Domane road bike – which was specifically designed to race over the cobbled roads of Northern France and is also not particularly bothered by a sleeping policeman or two. In fact, most modern bikes aren’t particularly bothered by vertical deflection traffic calming.
So one of the intended purposes – slowing down bikes – won’t happen. Or at least won’t happen consistently and predictably.
But the speed cushions will slow down cars. And this, somewhat counterintuitively, could be a problem.
Why?
Because it will set up a speed differential.
Cyclists, largely unhindered by the cushions, will be easily capable of travelling faster than cars on the same section of road. At the moment, cars and bikes are roughly on parity. But once the cushions go in, cars will need to brake for them. Something a cyclist might not see if there’s a car in front of them blocking the view is an imminent vertical deflection traffic calming device. Result: driver brakes more precipitously than expected and rider crashes into back of car.
Not cool.
A third problem, and this one might be the worst of the lot, is that emerging traffic from the side streets – the thing that has already been a proximate cause of accidents – will have a harder time judging the speed of bikes coming down the hill. Drivers may expect a speedbump to slow a rider, but as we’ve discussed above, it may well not have that effect. The end result is that cars may be more likely to pull out in front of a descending rider than before, since they’ll be expecting the rider to slow down for a bump when the he/she has no such intention. Couple that with the already mentioned speed differential between cars and bikes and it’s going to actually be harder to traffic to emerge from the side streets safely.
There’s plenty of discussion of other potential issues over at Sydney Cyclist.
And all this makes me a bit apprehensive.
Chances are, as with most things, not much will change. Users of the road will adapt, some people will alter their routes, others will alter their behaviour. People will get used to the change. But on balance, putting the cushions in is, to my mind, a waste of time and money. A far more effective solution, for the cost of a couple of pots of paint and some shovel work, would be to open up the lines of sight at the junctions by paring back the on-street parking by a few metres. This would give drivers a precious few extra seconds to ensure they’re safe to pull out, and give riders a better view of potential danger ahead.
But, as we know, infrastructure is seldom done right.
You might be right about cars braking and bikes crashing into back or overtaking etc. also about emerging cars thinking cyclists will slow. Another point is that while cyclists are looking at the speed hump coming up and getting prepared, they are less likely to be looking sideways for emerging cars.
As to what percentage of cyclists are doing over 55, which is the number council and police are probably thinking of, I can get to 50 coasting easily enough about 2/3 of way down, from a slow start up top. I reckon if they put the speed counter rubber things across the road between. Charles and Hubert St, they would get a lot of over 55s, as they are measuring spot speeds, not averages.
They claim to have measured just that, an 85%-ile speed of 60, but they haven’t said if cars or bikes are responsible or what fraction is bikes. Not sure if they can distinguish. When are most strava attempts, does it say when?
Hey Bob – I can’t determine time of day wihtout getting access to to other people’s data, but intuitively it’d be afternoon commute. Spot speeds would probably be fairly high at the bottom, you’re right
On four cold winters nights in 2015, for periods between 5pm and 7:30pm, I recorded the displayed speeds of cars and bicycles descending the Lilyfield Road as displayed by the Leichhardt Council speed radar unit installed on the corner of Hubert Street.
The radar displays speeds up to 55 kph. Speeds of 56kph and above are displayed as “SLOW DOWN” and appear in my data as 56 kph.
SUMMARY
7/7/15 9/7/15 30/7/15 19/8/15 AVERAGE
BIKES
percent 41 to 50kph 73.0 52.1 57.4 53.3 58.9 %
percent 51 to 55kph 14.9 39.7 21.3 45.7 30.4 %
percent over 55kph 0.0 4.1 1.6 1.0 1.7 %
CARS
percent 41 to 50kph n.a. 36.0 58.0 42.5 45.5 %
percent 51 to 55kph n.a. 22.5 18.6 22.8 21.3 %
percent over 55kph n.a. 29.2 12.4 15.7 19.1 %
The bicycle and car speeds recorded are probably close to the maximum speeds those vehicles achieved.
My impression is that there is a de-facto +10% tolerance on road speeds in NSW. These figures show that very few cyclists travel in excess of this +10% speed whereas 19% of motor vehicles do.
I suppose this is simply an illustration of the fact that cars travel faster than bicycles even on a steep downhill slope.